Product Name
CLL chromosome and gene anomaly probe detection kit
Package Specifications
10 Tests/box
Intended use
This product is mainly used to detect chromosome and gene abnormalities in chronic lymphoblastic leukemia; The applicable population is patients suspected or diagnosed with chronic lymphocytic leukemia by routine clinical examination.
Chronic lymphocytic leukemia (CLL) is a mature B-lymphocyte clonal proliferative tumor characterized by lymphocyte aggregation in peripheral blood, bone marrow, spleen and lymph nodes. Peripheral blood B lymphocytes with clinical diagnosis of persistence (3 months)≥ 5×10⁹/L (e.g. peripheral blood B cells <5×10⁹/L), Chronic lymphocytic leukemia is also diagnosed in patients with hematopenia caused by bone marrow infiltration or disease related symptoms. Fluorescence in situ hybridization showed that about 80% of patients with chronic lymphoblastic leukemia had chromosome abnormalities, and the most common deletion was in the long arm del of chromosome 13 (13q14.1); Chromosome 12 deletion or trisomy; Chromosome 17 short arm deletion del (17p). These abnormalities are of great significance for the diagnosis, differential diagnosis, treatment and prognosis of chronic lymphocytic leukemia.
This kit is not clinically verified in combination with gene targeted therapeutic drugs, but only for gene detection performance. This kit is only applicable to the detection of chronic lymphocytic leukemia and provides doctors with auxiliary information for diagnosis.
Detection principle
Based on the fluorescence in situ hybridization technology, a nucleotide of the nucleic acid probe is labeled with fluorescein. The detected target gene is homologous and complementary with the used nucleic acid probe. After denaturation, annealing and renaturation, they can form a hybrid between the target gene and the nucleic acid probe. The detected gene is analyzed qualitatively, quantitatively or relatively under the microscope by the fluorescence detection system. The kit adopts orange probe labeled with orange fluorescein and green probe labeled with green fluorescein. The two probes can be combined with the target detection site by in situ hybridization.
Under normal conditions (without gene deletion and chromosome abnormality), it is displayed as two orange signals and two green signals under fluorescence microscope. When there is gene deletion, there will be a lack of green or orange signal. When there is chromosome polysomy, the probe signal will increase. Gene deletion and chromosome abnormalities were detected by this method, so as to provide reference basis for clinical identification, prognosis judgment and medication of leukemia patients.
Product Introduction
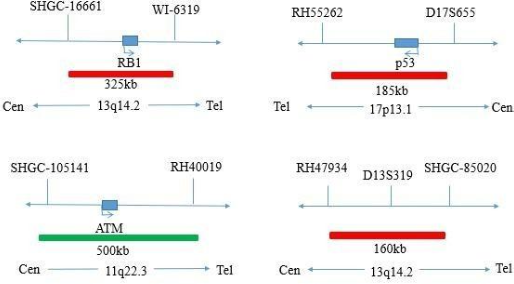
The kit uses orange fluorescein-labeled RB1 probe and green fluorescein-labeled ATM probe to bind the RB1 and ATM probe to the target detection site by in situ hybridization.
Product Composition
The kit consists of one of RB1/ATM, P53/CEP17, D13S319/CEP12 dual-color probes, as shown in Table 1.
Storage conditions & Validity
Keep sealed away from light at -20°C±5°C. The product is valid for 20 months. Avoid unnecessary repeated freezing and thawing that should not exceed 10 times. After opening, within 24 hours for short-term preservation, keep sealed at 2-8°C in dark. For long-term preservation after opening, keep the lid sealed at -20°C±5°C away from light. The kit is transported below 0°C.
Applicable Instruments
1. Fluorescence microscopy imaging system includes fluorescence microscopy and filter sets for DAPI, Green, and Orange.
Sample Requirements
1. Applicable specimen types: Fresh bone marrow specimens stored at 4°C for no more than 24 hours and used for FISH testing after culture.
2. If the sample is stored at a too high or too low (such as freezing) temperature, the sample will not be used for testing and should be discarded.
3. Bone marrow cell suspension for karyotyping should be stored at -20°C for FISH detection.
4. If the cells suspension is too volatile or contaminated during storage, the sample should be discarded.
Test method
1.Related Reagents
The following reagents are required for the experiment but not provided in this kit
- 20×SSC, pH 5.3±0.2
Weigh 176g of sodium chloride and 88g of sodium citrate, dissolve in 800mL of deionized water, adjust the pH to 5.3±0.2 at room temperature, and complete to 1 L with deionized water. High-pressure steam sterilization, stored at 2-8°C, the solution shelf life is of 6 months. Discard if the reagent appears cloudy (turbid) or contaminated.
- 2×SSC, pH 7.0±0.2
Take 100mL of the above 20xSSC, dilute with 800mL deionized water, mix, adjust the pH to 7.0±0.2 at room temperature, complete to 1L with deionized water, stored at 2-8°C, the shelf life is of 6 months. Discard if the reagent appears cloudy (turbid) or contaminated.
- Ethanol Solution: 70% ethanol, 85% ethanol
Dilute 700ml, 850ml of ethanol with deionized water to 1L. The shelf life is of 6 months. Discard if the reagent appears cloudy (turbid) or contaminated.
- 0.3% NP-40/0.4xSSC solution, pH 7.0-7.5
Take 0.6mL NP-40 and 4mL 20×SSC, add 150mL deionized water, mix, adjust the pH to 7.0-7.5 at room temperature, with deionized water complete to a volume of 200mL. Stored at 2-8°C, the shelf life is of 6 months. Discard if the reagent appears cloudy (turbid) or contaminated.
- Fixation solution (methanol: glacial acetic acid = 3:1)
Prepare a ready to use fixation solution by mixing thoroughly 30ml of methanol and 10ml of glacial acetic acid.
- 0.075M KCl solution
Weigh 2.8g of potassium chloride, dissolve in 400mL of deionized water and complete to 500mL with deionized water. Stored at room temperature, the solution shelf life is of 6 months. Discard if the reagent appears cloudy (turbid) or contaminated.
- Diamidinyl phenylindole (DAPI) counterstain
Use commercially available anti-quenching DAPI counterstain.
Sample collection and slides preparation
- Sample collection: Take heparin anticoagulated bone marrow samples.
- Cell harvest: The bone marrow cells sample (cultured or uncultured) is pipetted to the tip of centrifuge tube and centrifuge at 1000rpm for 10 minutes to remove the supernatant.
- Cells hypotonicty: Add 6-8mL of 0.075mol/L KCl solution pre-warmed to 37°C, mix with a pipette and place in an incubator at 37°C for 20-30min.
- Pre-fixation: Add 2 mL of 3:1 methanol and glacial acetic acid fixative solution, mix with a pipette, and centrifuge at 1000 rpm for 10 min.
- Fixation:
Aspirate the supernatant, add 5 mL of freshly prepared 3:1 methanol and glacial acetic acid fixative solution, mix with a pipette, fix for 10 min, and centrifuge at 1000 rpm for 10 min.
- Repeat step 5 twice.
- Cell suspension preparation: Pipet the supernatant and add the appropriate amount of fixative solution to prepare the appropriate cell suspension concentration. Slide preparation: Use a pipette to gently mix the cell suspension and drip a small amount onto a clean, fat-free glass slide soaked in ethanol, each slide, drop 1 to 2 drops, and place at 56°C for 0.5 hours.
- The prepared slides can be stored at 4°C or at -20°C in a refrigerator for about 1 to 4 weeks.
Slides processing
- At room temperature with 2×SSC (pH 7.0) solution, rinse the slide 2 times for 5min each time.
- Place the slides in 70% ethanol, 85% ethanol and 100% ethanol for 2min each time, dehydrate and air dry.
- Carry out the hybridization experiment according to the hybridization procedure.
Denaturation and Hybridization
The following operations should be performed in a darkroom.
- Take the probe at room temperature for 5 minutes. Briefly centrifuge manually (do not use vortex or shaker instrument). Take 10μL droplet in the cell and drop in the hybridization zone, immediately cover 22mmx22mm glass slide area; spread evenly without bubbles the probe under the glass slide covered area and seal edges with rubber (edge sealing must be thorough to prevent dry film from affecting the test results during hybridization).
- Place the glass slide in the hybridization instrument, denature at 88°C for 2 minutes (the hybridizer should be preheated to 88°C) and hybridize at 45°C for 2 to 16 hours.
Washing
The following operations should be performed in a darkroom.
- Take out the hybridized glass slides, remove the rubber on the coverslip and immediately place the slides into 2xSSC for 5 seconds, and gently remove the coverslip.
- Place the glass slides in 2xSSC at room temperature for 1 min.
- Remove and immerse the slides in a 0.3% NP-40/0.4×SSC solution preheated at 68°C for 2 min. (Preparation of 0.3% NP-40/0.4xSSC: For 1L preparation, take 3mL NP-40 and 20mL 20xSSC, dissolve fully, mix well, and use 1M NaOH to adjust the pH to 7.2).
- Immerse the glass slides in deionized water at 37°C for 1min, and dry naturally in the dark.
Counterstaining
The following operations should be performed in a darkroom.
10-15μl DAPI compound dye is dropped in the hybridization area of the glass slide and immediately covered for 10-20min. The suitable filter is selected for glass slide observation under the fluorescence microscope.
FISH results observation
Place the stained sections under a fluorescence microscope and the cells area is first confirmed under a low magnification objective (10x);under magnification objective (40x) a uniform cells distribution is observed; then the nucleus size uniformity, nuclear boundary integrity,DAPI staining uniformity, no nuclei overlapping, cells clear signal are observed in the high magnification objective (60x, 100x). Select randomly 200 cells at least and count the orange and green signals in the nuclei.
Positive judgment value or reference interval
- Signal classification and counting
- Normal cell signal: there are 2 orange red signals and 2 green signals in a single interphase nucleus.
- Main missing signals:
RB1/ATM: there are two orange signals and one green signal in a single interphase nucleus, and the ATM gene in 11q 22.3 region is missing;1 orange signal, 2 green signals, 13q14 RB1 gene deletion in region 2.
P53/CEP17: there are 1 orange signal and 2 green signals in a single interphase nucleus, 17p13 P53 gene deletion in region 1;
D13S319 / cep12: there are 1 orange signal and 2 green signals in a single interphase nucleus, 13q14 Deletion of D13S319 locus in region 2;
There were 0 orange signals and 2 green signals in a single interphase nucleus, 13q14 Homozygous deletion of D13S319 locus in region 2;
There are 2 Orange signals and 3 green signals in a single interphase nucleus, + 12.
200 cells were randomly counted, and the number of normal signal cells and two different abnormal signal cells were counted respectively.Each cell is counted once. Only cells with hybridization signal (both color signals) are counted. Cells without signal or only a single color signal are not counted. Cells with weak signal or too diffuse signal are not counted.
- FISH result judgment
To judge the abnormality of the detection result, it is necessary to establish the abnormality threshold.
- Abnormal threshold establishment
- It is recommended to select 20 bone marrow samplesfrom non leukemia patients or normal people as negative control.
- The slides were prepared by the above methods and steps for fish experiment.
- Establishment of abnormal threshold: 200 cells are analyzed for each sample, and the average value and standard deviation of the percentage of cells showing abnormal signal mode are calculated. The abnormal threshold is defined as the average value + 3 × Standard deviation.
Anomaly threshold = mean (m) + 3 × Standard deviation (SD)
Example: Table 2: 20 samples of non-leukemia patients or normal people were selected as negative controls for fish detection.
Table 2: Abnormal threshold setup
| No. |
Abnormal cells (%) |
|
Sample 1
Sample 2
..................
Sample 20
Mean
SD
Threshold Value
|
5
4
............
4
3
0.3
(Anomaly threshold = Mean value + 3 x SD) = 3.9
|
2. Result judgment:
If the detection value of the number of cells displaying abnormal signal mode is greater than the abnormal threshold, it is determined as a positive result; If the detection value of the number of cells displaying abnormal signal mode is less than the abnormal threshold, it is determined as a negative result; If the detection value of the number of cells in abnormal signal mode is equal to the abnormal threshold, increase the number of observation sample cells and count 500 cells to judge the final result.
Taking Table 2 as an example, if the percentage of abnormal signal cells in the RB1 gene fish test results of the sample to be tested is greater than 3.9%, that is, the abnormal threshold (e.g. 8%), it is judged that the patient has 11q deletion; If the percentage of abnormal signal cells in the RB1 gene fish test results of the sample to be tested is less than 3.9%, that is, the abnormal threshold (e.g. 2%), it is judged that the patient has no 11q deletion. The results of other gene loci were judged as above.
Product performance index
- Fluorescence signal intensity: after the probe is effectively hybridized with the karyotype sample, it shall send out a fluorescence signal that can be recognized by the naked eye under the fluorescence microscope.
- Sensitivity:
2.1 sensitivity of RB1 gene probe: 100 chromosomes 13 of 50 cells in metaphase division phase were analyzed, and at least 98 chromosomes 13 were stained
The body displays an orange fluorescent signal.
2.2 ATM gene probe sensitivity: 100 chromosomes 11 of 50 cells in metaphase division phase were analyzed, and at least 98 chromosomes 11 showed a green fluorescence signal.
2. Sensitivity of P53 gene probe: 100 chromosomes 17 of 50 cells in metaphase division phase were analyzed, and at least 98 chromosomes 17 showed an orange fluorescence signal.
2.4 CEP17 centromere probe sensitivity: 100 chromosomes 17 of 50 cells in metaphase were analyzed, and at least 98 chromosomes 17 showed a green fluorescence signal.
2.5 D13S319 site probe sensitivity, 100 chromosomes 13 of 50 cells in metaphase were analyzed, and at least 98 chromosomes 13 showed an orange fluorescence signal.
2.6 CEP12 centromere probe sensitivity: 100 chromosomes 12 of 50 cells in metaphase division phase were analyzed, and at least 98 chromosomes 12 showed a green fluorescence signal.
- Specificity:
3.1 specificity of RB1 gene probe: 100 chromosomes 13 of 50 cells in metaphase division phase were analyzed, and at least 98 chromosomes 13 showed a specific orange fluorescence signal in the target region.
3.2 ATM gene probe specificity: 100 chromosomes 11 of 50 cells in metaphase division phase were analyzed, and at least 98 chromosomes 11 showed a specific green fluorescence signal in the target region.
3.3 P53 gene probe specificity: 100 chromosomes 17 of 50 cells in metaphase division phase were analyzed, and at least 98 chromosomes 17 showed a specific orange fluorescence signal in the target region.
3.4 CEP17 centromere probe specificity: 100 chromosomes 17 of 50 cells in metaphase division phase were analyzed, and at least 98 chromosomes 17 showed a specific green fluorescence signal in the target region.
3.5 D13S319 site probe specificity, 100 chromosomes 13 of 50 cells in metaphase division phase were analyzed, and at least 98 chromosomes 13 showed a specific orange fluorescence signal in the target region.
3.6 CEP12 centromeric probe specificity: 100 chromosomes 12 of 50 cells in metaphase division phase were analyzed, and at least 98 chromosomes 12 showed a specific green fluorescence signal in the target region.
Precautions
1. Please read this manual carefully before testing. The testing personnel shall receive professional technical training, and the signal counting personnel must be able to observe and distinguish orange and green signals.
2. When testing clinical samples, when it is difficult to count the hybridization signal and the samples are not enough to repeat the retest,the test will not provide any test results. If the amount of cells is insufficient for analysis, the test will not provide test results.
3. Formamide and DAPI counterstaining agent used in this experiment have potential toxicity or carcinogenicity. It is necessary to operate in the fume hood and wear masks and gloves to avoid direct contact.
4. The results of this kit will be affected by various factors of the sample itself, but also limited by enzyme digestion time, hybridization temperature and time, operating environment and the limitations of current molecular biology technology, which may lead to wrong results.Users must understand the potential errors and accuracy limitations that may exist in the detection process.
5. All chemicals are potentially dangerous. Avoid direct contact. Used kits are clinical waste and should be properly disposed of.